

The MMS Clubhouse · Seller research · No. 01
When should you list sports cards on eBay?
What 607 days of store history taught us about listing consistently, selling through sports seasons, and giving the right cards their moment.
The short answer
List consistently, but give time-sensitive stock priority.
If we were planning an eBay card store from scratch, we would build a sustainable listing routine, prepare stock ahead of each sport’s season, and publish relevant new releases promptly. We would not hold a newly released set back just to satisfy a daily posting quota.
That recommendation comes from examining 6,965 recorded sales across 607 days at MONKEY MAN Sports. We compared listing volume, distinct listing days, batches, time to sale, inventory estimates and sports calendars. The same lesson kept resurfacing: how much you list matters, but the cards you choose and the demand they meet change the result.
Three things we would act on
- Be ready when attention arrives. Use season openers, playoffs and verified set releases to prioritize the preparation queue.
- Keep the catalogue working. About 56% of recorded sales happened more than 30 days after listing.
- Test consistency at a fixed workload. Spread comparable ordinary inventory across more days before assuming you need to list more cards.
This is a case study of one Canadian store, not a measurement of the whole eBay market. Our sales show what buyers purchased from us. They do not tell us every buyer’s motivation, whether a buyer discovered us through search, or how eBay ranked a listing.
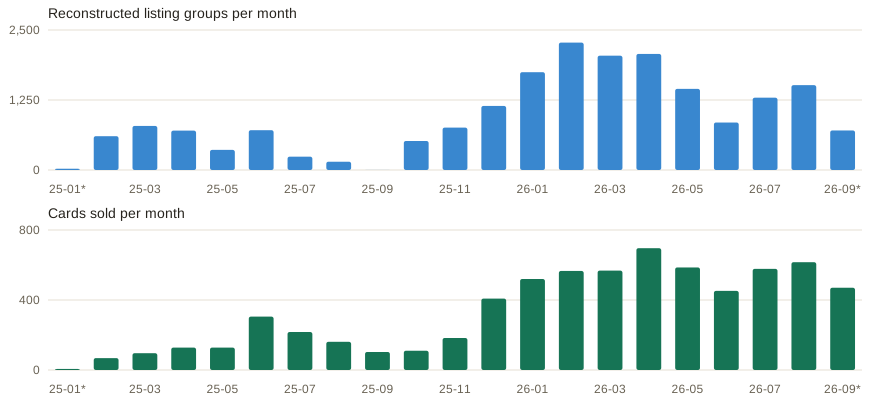
The full history: more stock, more sales—and plenty of variation
01 / Volume and consistency
Does listing sports cards every day increase eBay sales?
Our history makes a consistent listing routine worth testing at a workload you can sustain. Across 19 complete months, months with more distinct listing days also tended to have more sales: the correlation was 0.72. Within the eight complete months of 2026, that relationship was weaker, at 0.33.
The comparison is easy to see. April 2026 had 21 listing days and 696 sales. June had 14 listing days and 452 sales. But August produced 616 sales from 15 listing days, beating January’s 520 sales from 21 days. Frequency alone cannot explain the order.
Every month, ranked by cards sold
| Month | Listing days | Cards sold | Start stock (est.) | End stock (est.) |
|---|---|---|---|---|
| 2026-04 | 21 | 696 | 9,741 | 10,922 |
| 2026-08 | 15 | 616 | 12,806 | 14,280 |
| 2026-05 | 15 | 586 | 10,922 | 11,659 |
| 2026-07 | 18 | 578 | 12,001 | 12,806 |
| 2026-03 | 20 | 568 | 8,306 | 9,741 |
| 2026-02 | 21 | 566 | 6,348 | 8,306 |
| 2026-01 | 21 | 520 | 5,005 | 6,348 |
| 2026-09 * | 10 | 470 | 14,280 | 14,663 |
| 2026-06 | 14 | 452 | 11,659 | 12,001 |
| 2025-12 | 19 | 408 | 4,137 | 5,005 |
| 2025-06 | 16 | 305 | 2,422 | 2,873 |
| 2025-07 | 3 | 217 | 2,873 | 3,029 |
| 2025-11 | 11 | 183 | 3,344 | 4,137 |
| 2025-08 | 3 | 161 | 3,029 | 3,018 |
| 2025-04 | 14 | 128 | 1,493 | 2,146 |
| 2025-05 | 9 | 128 | 2,146 | 2,422 |
| 2025-10 | 11 | 110 | 2,916 | 3,344 |
| 2025-09 | 1 | 103 | 3,018 | 2,916 |
| 2025-03 | 13 | 96 | 754 | 1,493 |
| 2025-02 | 13 | 68 | 72 | 754 |
| 2025-01 * | 2 | 6 | 1 | 72 |
Listing quantity tells a related story: its monthly correlation with sales was 0.87, partly reflecting the store growing over time. The next-week relationship fell from 0.69 for weekly totals to 0.20 for week-to-week changes. A bigger catalogue and an immediate payoff from extra work are different questions.
What changes when you account for the sports calendar?
A simple playoff adjustment raised the 2026 listing-days correlation from 0.33 to 0.63. That supports a useful hypothesis: buyer demand can make the same listing effort behave differently at different times of year. Across all 19 complete months, the adjusted relationship stayed near 0.72.
Eight months are too few to treat that adjustment as a rule. Removing one month at a time produced adjusted correlations between 0.27 and 0.94. These figures adjust for playoff windows only; the regular-season shading in the charts below is additional context, not an extra model control.
How can you test a more consistent listing schedule without adding work?
Keep batch preparation and vary when you publish. About 70% of timestamped starts arrived in sessions of at least 50 listings, so batching is already a familiar way to work. A useful next test is to spread a comparable weekly quantity across more days. More frequent listing and higher volume tended to occur together in our history; holding quantity steady helps separate those effects before testing an every-two-hours schedule.
Give that experiment a solid foundation: complete listings, clear photos and competitive terms. eBay describes Best Match as a combination of relevance, price, listing quality, service terms and seller history. Its guidance does not establish a two-hour posting rule. Read eBay’s Best Match guidance.
Prepare cards in efficient batches. Test publishing ordinary backlog on more days while keeping weekly quantity, sport mix and pricing similar. Evaluate several weeks and the following 30 days, rather than judging a listing session by that night’s sales.
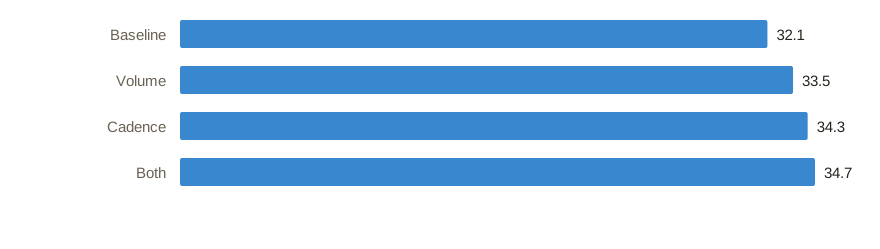
Did listing effort improve next-week sales predictions?
02 / Football · NFL
When is the best time to list football cards on eBay?
We would have relevant football inventory ready before Week 1, stay active during the season, and keep playoff contenders easy to find. That is a planning recommendation, not evidence that one opening-week date maximizes every card’s price.
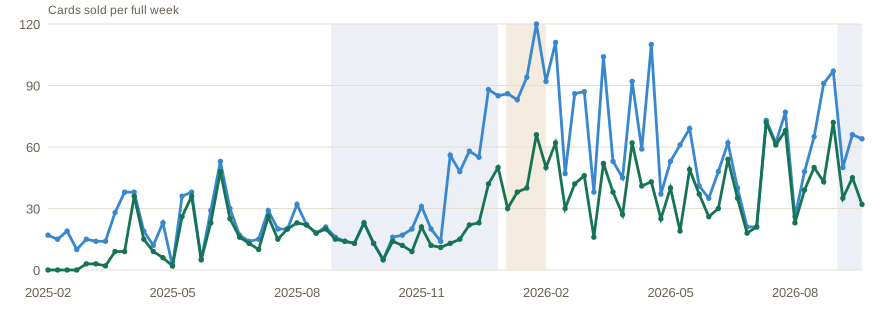
Football is our strongest sample: 3,783 NFL sales. During the 2026 NFL playoff window, sales averaged 14.07 cards per day, compared with 11.21 in the preceding 28 days and 11.82 in the following 28. That is approximately 25% above the pre-playoff daily pace.
NFL card sales through the regular season and playoffs
Which existing football cards deserve attention before the playoffs?
Start by reviewing the player and team inventory already on your shelves. Older-stock NFL sales rose from 5.21 per day before the playoffs to 6.90 during them. That makes the existing catalogue worth preparing alongside new listings. Clear identities, condition photos and current pricing are practical priorities; the league-level result does not identify which individual cards will benefit.
Listing activity increased too: we recorded NFL listing activity on 14 of the 28 days before the playoffs and 21 of the 30 playoff-window days. We cannot credit the sports calendar with the entire sales increase while ignoring the work happening at the same time.
Prepare player and team inventory ahead of the season, make accurate player/team/set searches possible, and review comparable sold prices when attention changes. Keep a reserve of ordinary stock for the cadence experiment, but release genuinely time-sensitive football cards promptly. Do not assume every player or every parallel follows the league average.
03 / Hockey · NHL
Should you sell hockey cards during the Stanley Cup Playoffs?
Keep relevant hockey stock available, but separate playoff attention from new-set demand. Across 1,157 NHL sales, our clearest 2026 pattern was not simply “more sales after the playoffs begin.” A substantial fresh-stock surge came first.
NHL card sales through the regular season and playoffs
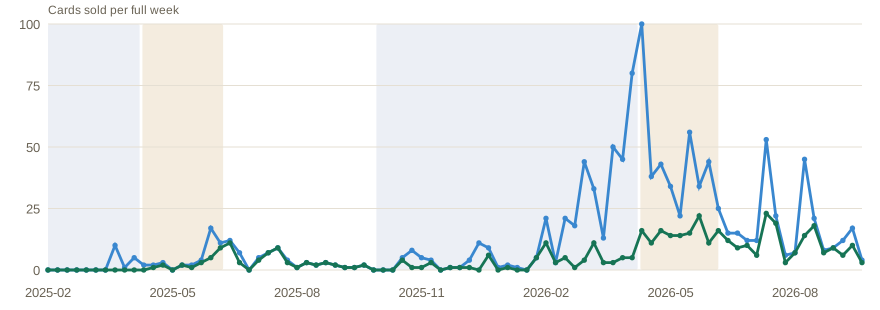
Why did total hockey sales peak before the playoffs?
In the 28 days before the 2026 playoffs, NHL sales averaged 9.43 cards per day, versus 5.34 during the playoffs. That earlier window included the strong April response to newly listed National Hockey Card Day and Flair cards. A calendar-only reading would miss the product mix.
Older-stock sales tell a different story: 0.93 per day before, 2.14 during, and 1.32 in the following 28 days. The playoff period coincided with stronger sales of inventory that had already been listed for more than a month.
Use two queues: newly available hockey sets and established player/team inventory. Prioritize timely releases while keeping the catalogue searchable for fans following a team’s run. Measure those two groups separately; a new-set burst can conceal improving demand for older cards.
04 / Basketball · NBA
How should you plan basketball listings around the NBA playoffs?
Prepare for playoff interest and keep tracking sales after the Finals. We recorded 481 NBA sales. In 2026, the daily pace rose from 1.18 in the 28 days before the playoffs to 1.49 during them. It then rose further, to 2.18 in the 28 days after the Finals.
NBA card sales through the regular season and playoffs
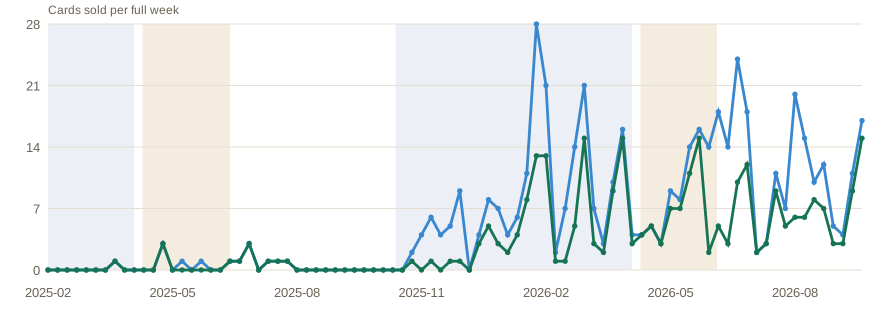
How can you tell which basketball inventory is responding?
Separate recently listed cards from the established catalogue. Older-stock NBA sales averaged 1.07, 0.98 and 0.96 per day across the three windows, while total sales increased. We introduced 294 reconstructed NBA listing groups during the playoffs, compared with just two in the preceding 28 days. Following those new batches for an equal period gives a more useful view of the response than treating the entire basketball catalogue as one group.
Have relevant inventory prepared before major attention windows, then track player, set and listing age rather than applying one basketball-wide “playoff premium.” Keep measuring after the Finals. A card that sells later may be responding to an earlier listing batch.
05 / Baseball · MLB
How can you prepare baseball inventory for Opening Day and October?
Prepare before Opening Day, keep ordinary inventory available, and use later player and team interest to prioritize your next listings. Our history contains 180 MLB sales, compared with 3,783 NFL sales. The store’s baseball selection and listing effort are too different to treat the football results as a baseball forecast.
The practical buyer questions are specific: is someone searching for this player, this team, this rookie issue, or a missing card from a set? Those are useful listing and inventory categories, not motivations we have measured from buyer interviews.
MLB: a smaller sample, shown on its own
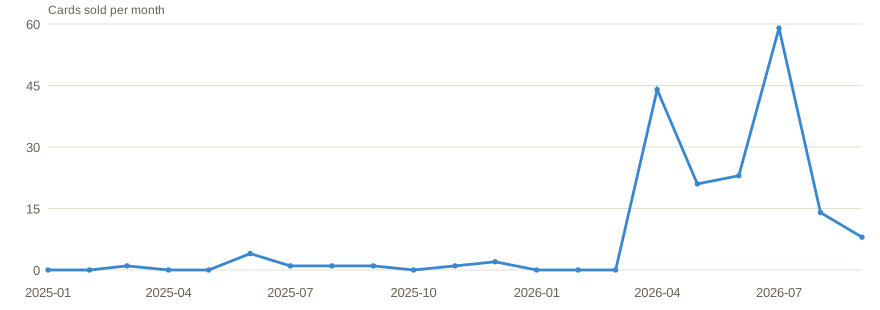
List accurate, well-photographed baseball inventory when it is ready. Use Opening Day and the postseason as planning reminders, not reasons to hide ordinary cards for months. Record player/team, set release and listing dates so a larger sample can separate seasonal demand from changes in what the store offered.
06 / Basketball · WNBA
How should you build a listing schedule for WNBA cards?
Give WNBA inventory its own calendar and performance review. Our 216 WNBA sales are a distinct sample; pooling them into the NBA figures would blur the comparison. This study has not fitted a WNBA season or playoff adjustment, so it cannot support a league-specific best month.
WNBA: a smaller sample, shown on its own
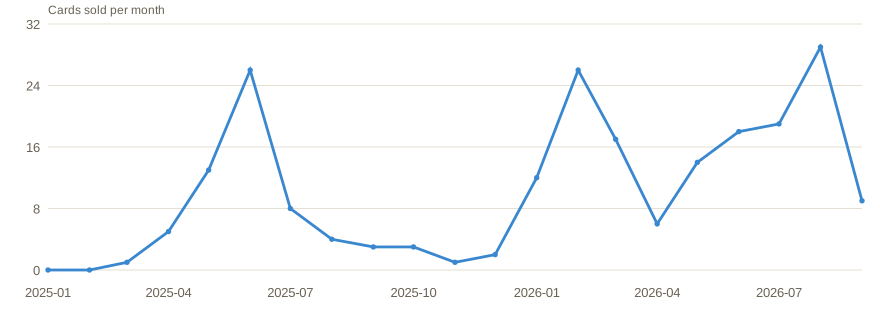
For the store, the useful question is whether a sale followed a new WNBA listing, renewed interest in an existing card, or a particular set becoming available. Keep the sport, product year and set identity correct, and compare equal follow-up periods before moving inventory effort between basketball categories.
07 / New releases and patient inventory
Should you list a newly released set immediately or spread it out?
Our operating preference is to publish relevant new-release stock promptly, once identity, condition and price have been checked. Use ordinary inventory to test a slower release schedule. We have not established a universal “within six hours” advantage.
One comparison illustrates why. The April 18, 2026 wave of 2025 Chrome Football produced 50 sales within 30 days from 154 reconstructed observed card units. The larger August 25 wave produced 28 from 260 units. Both cohorts had a recorded median asking price of $3.45.
One set, two waves: equal time to sell
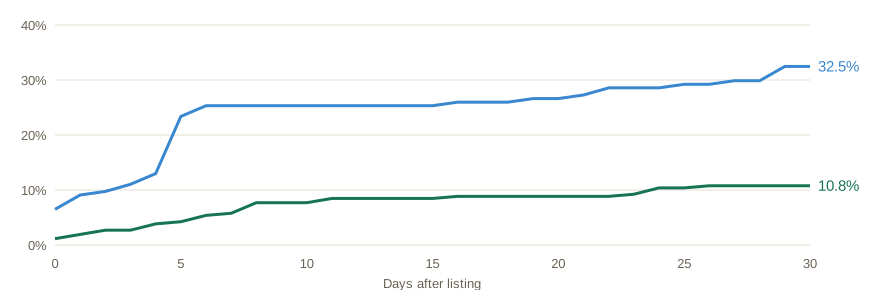
The April wave followed the product’s April 15 release. However, these were different cards from the same family, not identical inventory in a controlled test. Player and parallel mix, price changes, restocks and removed stock can affect the result. The reconstructed denominators are sold units plus remaining stock, not audited opening quantities. Manufacturer release context.
Did new cards explain April’s stronger sales?
Compared with February, April had 130 more sales: 135 more from cards listed within 30 days, offset by five fewer older-stock sales. Three families—Chrome Football, National Hockey Card Day and Flair—contributed 161 April sales and none in February. Of those April sales, 153 happened within seven days of listing.
That explains a particular month, not every month. July’s increase over June worked differently: 94 of its 126 additional sales came from older stock. Keep both the fast response and the slow accumulation in view.
How long do sports cards take to sell on eBay?
Among our recorded sales, the median time from listing to sale was 43 days. About 22% sold within seven days, while 56% sold after more than 30 days. These are ages of cards that sold; they are not a promise that an unsold card will sell within 43 days.
Time between listing and sale
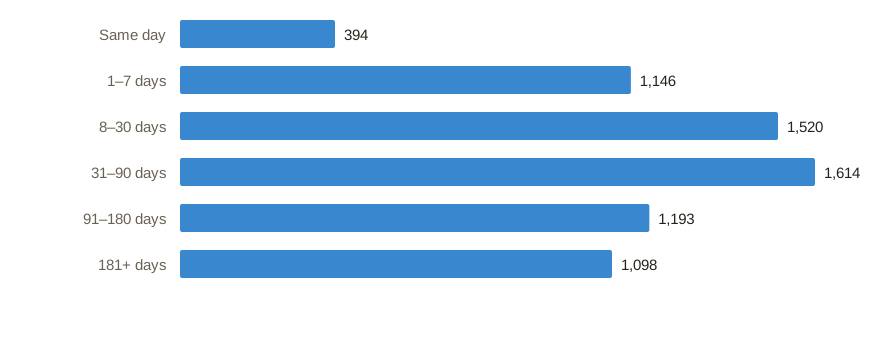
Printed year is not release age. A newly listed card from an older set can still match a current collector’s search. A current-year card may have been available for months. Track publication date, actual product release date where verified, and sale date as different facts.
08 / A practical store playbook
How would we run an eBay sports-card store using these findings?
We would optimize for useful inventory, sustainable work and contribution after costs. Selling more cards is not automatically a better result if the extra photography, fees, packaging and fulfilment absorb the return. This study measures sales response, not the profitability of every listing decision.
Prepare around demand windows.
Keep one calendar for sport seasons and one for verified releases. Bring likely relevant stock forward in the preparation queue without speculating that every playoff card deserves a higher price.
Batch the work; test the publishing.
Photograph and describe similar cards together. For ordinary backlog, preassign comparable batches to concentrated versus spread-out publishing weeks. Keep weekly quantity, mix and pricing approximately equal.
Preserve the slow-selling catalogue.
Review stale prices, weak photos and incomplete identities before concluding an older listing is worthless. Track removals and restocks so the inventory balance remains meaningful.
Measure the next 7 and 30 days.
Record sales from the new batch, sales from older stock, listing days, listed units, net contribution and time spent. Follow each batch for the same duration; do not compare a week-old batch with a month-old one.
What would an initial listing-consistency experiment look like?
As a practical starting design, prepare matched ordinary-stock batches across at least eight weeks and randomly assign weeks to two schedules—for example, two publishing days versus five. Use the same planned weekly card quantity. This is an experiment proposal, not a statistically determined minimum sample or a proven optimal schedule.
Keep urgent releases outside the experiment and record them separately. Review results after every batch has 30 days of follow-up. If a schedule improves sales without increasing work, repeat it across another demand period before declaring it the store’s permanent routine. Seasonality and carryover from prior weeks will still need attention.
We would choose a repeatable process before choosing a daily quota.
For listing quality, our checklist is straightforward: correct player, year, set, card number and parallel; clear condition evidence; appropriate pricing; and explicit shipping and handling terms. These practices align with eBay’s listing guidance. They also give a buyer the information needed to decide whether this is the right card.
09 / More seller questions
Questions we would ask before changing the listing routine
How many sports cards should I list per day on eBay?
Choose a starting quota from the time you can reliably give to accurate listings and fulfilment. Track both cards listed and distinct listing days, then test spreading the same weekly quantity across more days. That gives you a store-specific baseline to improve; this study does not establish one number that fits every seller.
What should you track to learn whether listings attract new buyers?
Track listing dates alongside first-time and repeat orders, listing traffic and changes in store followers. Our saved window contains 373 orders from 283 distinct buyers: a useful starting point for studying repeat activity. A longer buyer history is needed to distinguish a genuinely new customer from someone returning after the window began. Adding traffic and follower records would help connect publication activity to discovery.
How should you organize single-set and mixed-card listing batches?
Keep same-set preparation for efficiency, then label each published batch by sport, set mix and price range. Both single-set and mixed batches precede sales in our history. Comparing similar quantities with equal follow-up time is the next step toward deciding which mix deserves more of your effort.
How can you measure a listing session’s effect on older inventory?
Track two outcomes separately: sales from the new batch and sales of cards listed more than 30 days earlier. Compare older-stock sales before and after several sessions, noting releases and sports events. Our results changed materially with the choice of sessions, which makes repeated comparisons more useful than crediting one busy sales day to the latest batch.
How do you find a practical day and time to list sports cards?
Start with publishing times you can maintain, and record exact listing and sale timestamps as you test alternatives. Our daily records already support comparing listing frequency and subsequent sales. Reliable transaction times would extend that work to hourly patterns; the current publication timestamps describe our routine rather than a proven best shopping hour.
How can you use the football and hockey offseason productively?
Keep ordinary inventory available, refresh weak listings and prepare stock for the next season. The charts show purchases outside playoff windows, so the existing catalogue still has a job to do. Quieter periods are also useful for testing a sustainable publishing routine ahead of the next demand window.
10 / What sits behind the charts
Our data, definitions and limits
MONKEY MAN Sports is the operating store behind this research. The analysis uses a local copy of our Simian records captured September 27, 2026. It covers January 29, 2025 through September 27, 2026: 607 calendar days, 21 observed months and 19 complete months.
- Sales: 6,965 canonical ledger records, including three merchandise-labelled rows retained in the overall series for reconciliation. League charts isolate the named sport. These are unit-sale records, not counts of unique buyers or orders. Prices quoted in this article are Canadian dollars.
- Listing activity: 14,725 identified eBay listing IDs plus 5,236 inferred groups across retained history. A listing group is not necessarily one card. Historical removals, renewals, relists and restocks are incomplete, and some groups are reconstructed from later sales.
- Inventory: month-boundary estimates assign observed sold plus currently remaining units to listing dates, then subtract recorded sales. They reconcile to 14,663 remaining single-card units at the snapshot, but do not establish exact historical balances.
- Dates: recovered listing timestamps follow the Edmonton business-day rollover at 22:00. Date-only ledger history stays as recorded; card ages use stored calendar dates. Regular-season and playoff bands use official calendar dates and include non-game days.
- Comparisons: before/after playoff rates use 28-day windows and include zero-sale days. NFL 2025 has incomplete coverage. NBA/NHL playoff windows largely overlap, so their union is used in the exploratory monthly adjustment.
- Interpretation: this is observational research from one changing store. Sport mix, stock size, release timing, pricing, promotions and buyer interest can move together. We distinguish observed patterns from suggested experiments.
Additional evidence: all playoff comparisons and batch composition
| Sport / year | Before: cards/day | Playoffs: cards/day | After: cards/day |
|---|---|---|---|
| NFL 2025 | Unavailable | 2.58 * | 2.11 |
| NFL 2026 | 11.21 | 14.07 | 11.82 |
| NBA 2025 | 0.04 | 0.09 | 0.18 |
| NBA 2026 | 1.18 | 1.49 | 2.18 |
| NHL 2025 | 0.64 | 0.68 | 0.96 |
| NHL 2026 | 9.43 | 5.34 | 1.93 |
| Listing-day mix | Days | Median starts | Next 7d sales |
|---|---|---|---|
| Mixed sports/sets | 109 | 103.0 | 103.0 |
| Mixed, one sport | 22 | 48.5 | 92.5 |
| One-set day | 59 | 71.0 | 105.0 |
| Unknown mix | 5 | 103.0 | 145.0 |
2025 NFL coverage starts partway through the playoff window; its pre-period is unavailable. NBA 2025 has only six playoff-window sales. Batch comparisons are descriptive, with overlapping follow-up windows and unequal product mixes.
Release-date checks: newly released versus new to our store
| Family | Release | First stored listing | Days later |
|---|---|---|---|
| 2026 · NFL · Flagship | 2026-08-21 | 2026-08-24 | 3 |
| 2026 · Marvel · Chrome | 2026-07-01 | 2026-07-23 | 22 |
These two examples do not test a within-six-hours launch strategy. Two other isolated listing groups predate their verified product release by more than seven days; those need source validation. Their dates were not silently corrected.
Official sports calendars and research references
- NFL 2024 regular season: 2024-09-05–2025-01-05. Official schedule 1 · Official schedule 2
- NFL 2025 regular season: 2025-09-04–2026-01-04. Official schedule 1 · Official schedule 2
- NFL 2026 regular season: 2026-09-09–ongoing at snapshot. Official schedule 1
- NBA 2024-25 regular season: 2024-10-22–2025-04-13. Official schedule 1
- NBA 2025-26 regular season: 2025-10-21–2026-04-12. Official schedule 1
- NHL 2024-25 regular season: 2024-10-04–2025-04-17. Official schedule 1
- NHL 2025-26 regular season: 2025-10-07–2026-04-16. Official schedule 1
- NFL 2025 playoffs: 2025-01-11–2025-02-09. Official source 1
- NFL 2026 playoffs: 2026-01-10–2026-02-08. Official source 1
- NBA 2025 playoffs: 2025-04-19–2025-06-22. Official source 1 · Official source 2
- NBA 2026 playoffs: 2026-04-18–2026-06-13. Official source 1 · Official source 2
- NHL 2025 playoffs: 2025-04-19–2025-06-17. Official source 1 · Official source 2
- NHL 2026 playoffs: 2026-04-18–2026-06-14. Official source 1 · Official source 2
- National Hockey Card Day release context: Upper Deck. Flair context: Upper Deck; no exact Flair launch-day effect is estimated.

From the MONKEY MAN Sports workbench
We are sharing the questions we ask while building our own card store—and the evidence that changes how we work. This first study is a baseline we can revisit as the catalogue and history grow.
Put your store’s data to work
What could your own sales history tell you?
We used records from Simian CMS to explore which cards sold, when they sold and how that related to our listing effort. Connecting those records gave us a clearer starting point for deciding what to do next.
If you’re building an eBay card business, let’s talk about yours. Tell us how you manage inventory and sales, where the work gets difficult, and what you want to understand. We can discuss how Simian CMS could fit your operation.
Get in touch with Simian CMS ↗